
The Revamped Dashboard is a powerful tool to help you monitor and improve your operations. We have extended the existing report module with easier navigation, enriched metrics, and customizable displays!
In addition, the Overview section bundles several critical metrics into one accessible location - whether you're evaluating sales trends, client behavior, or team contributions, providing a clear picture of your business’s performance.
Watch this video and discover how to optimize your dashboard insights in just a few minutes.
*This section is available on the desktop only now.
Dashboard Navigation
🖥️ Desktop:
- On your desktop, select "Insights" from the left-hand menu.
- Click on "Dashboard (Beta)".
- Review your Dashboard Overview for key metrics and insights such as expected revenue, week over week sales performance, and pet demographics.

📱App:
- In the app, select "Insights" from the left-hand menu.
- Tap "New Insights" in the top-right corner to switch to the new report dashboard.
- Review your Insights Overview for key metrics and insights such as expected revenue, week over week sales performance, and pet demographics.

1.Select Data Source
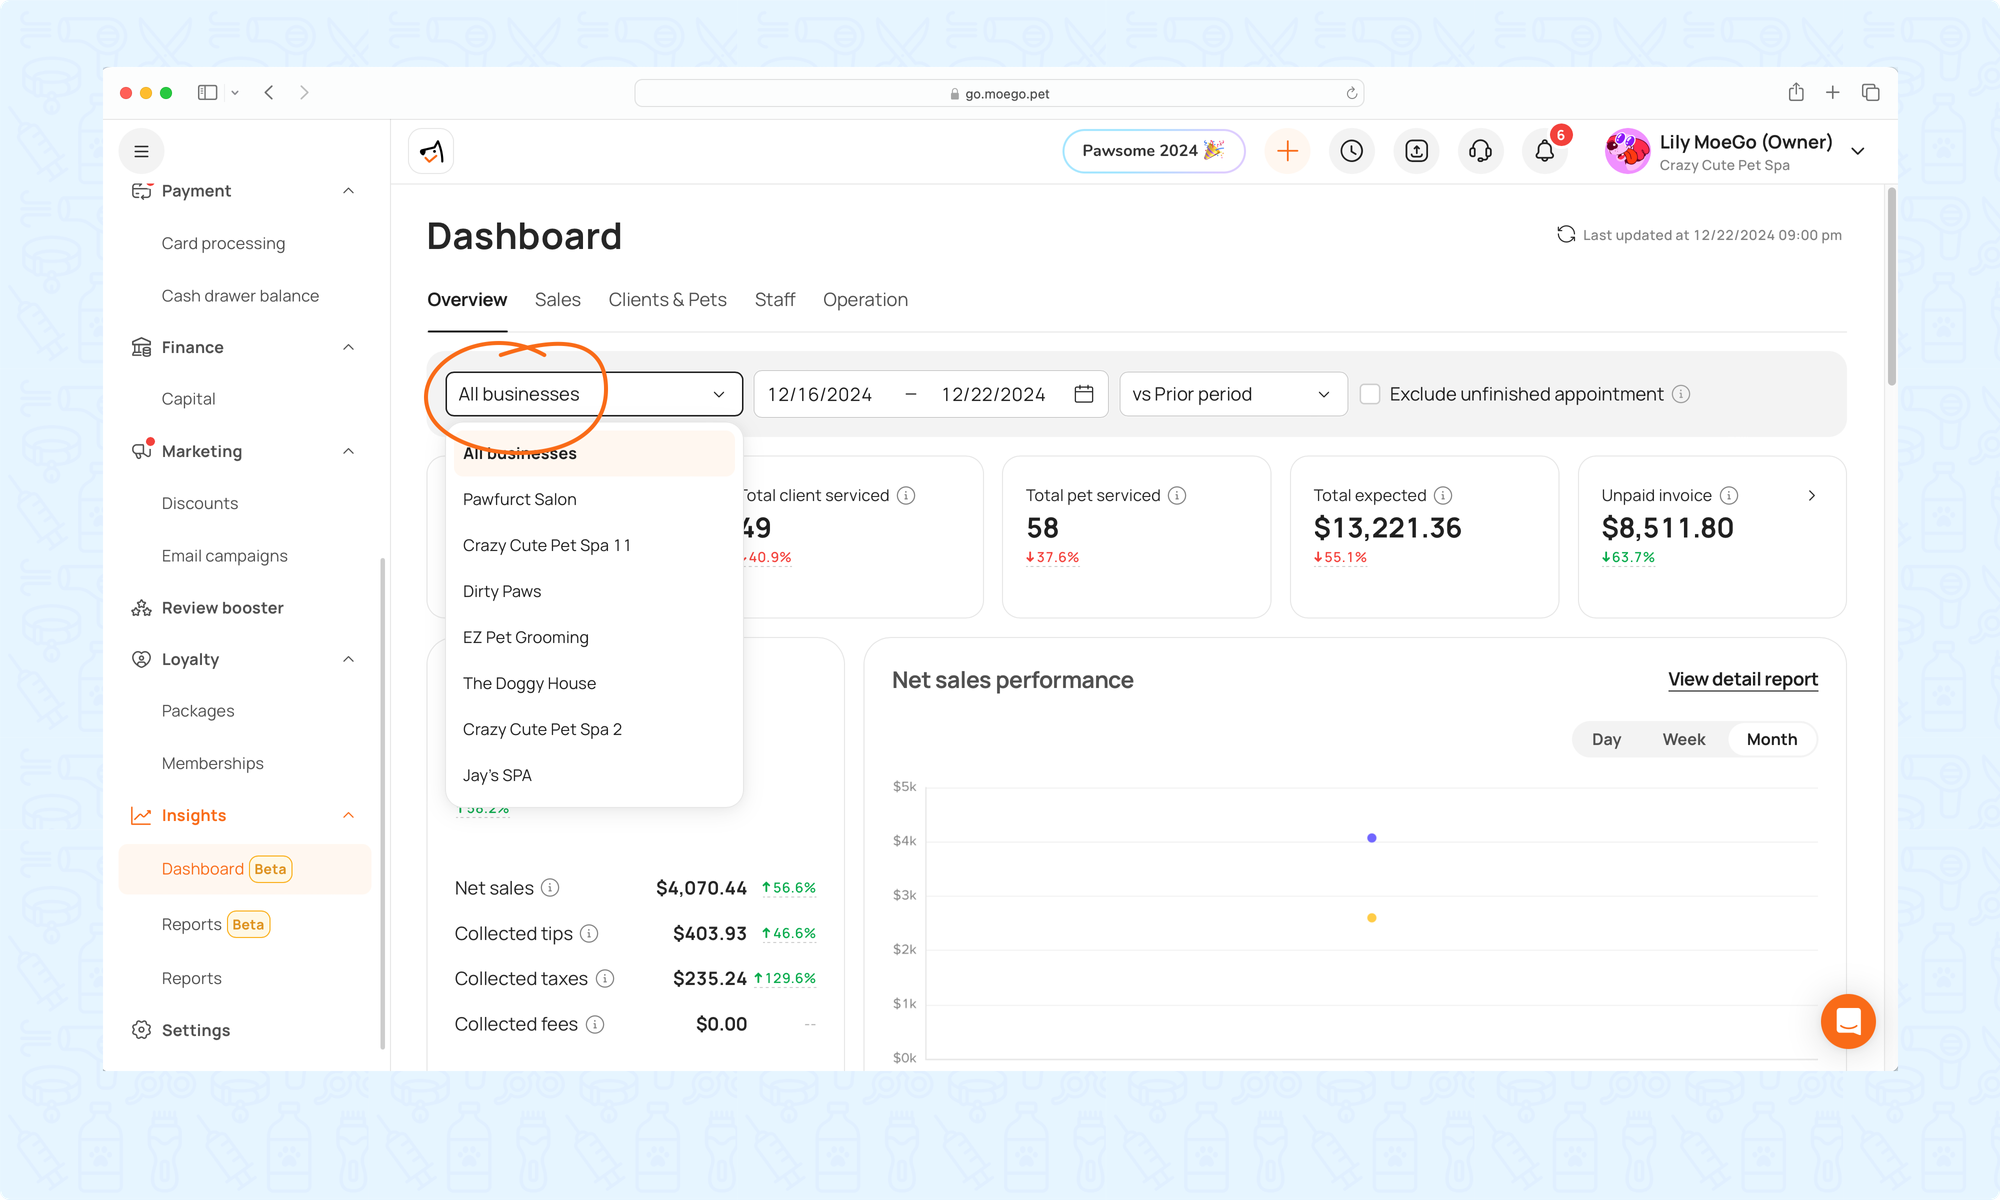
Select Data Source
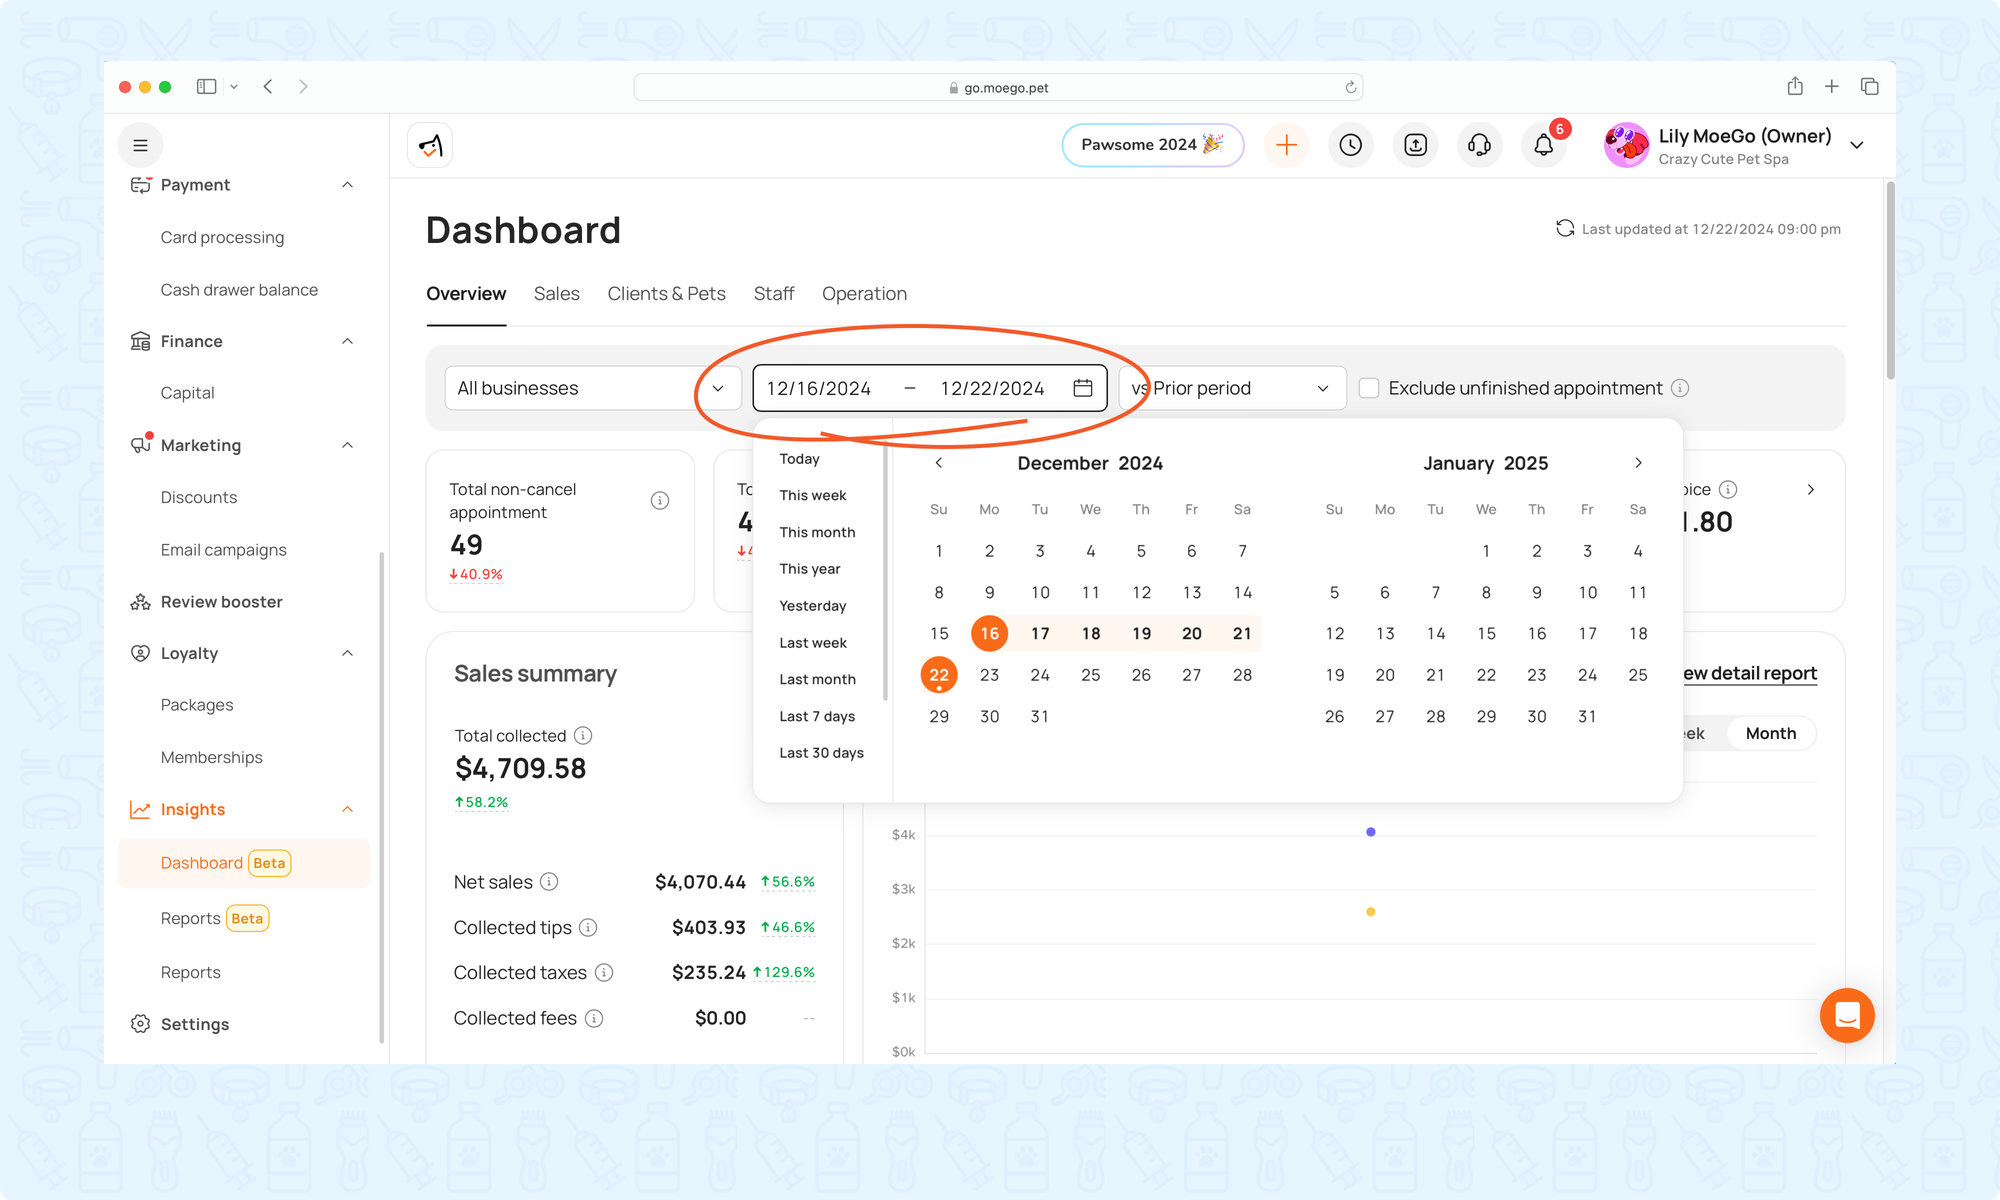
2.Select Data Range
- Date range: Choose a specific time frame (e.g., 12/11/2024 - 12/20/2024).
- Quick selection options include: Today, Yesterday, This Week, Last Week, Next Week, This Month, Last Month, Next Month, Last 7 Days, Last 30 Days, This Year, and Year-to-Date.
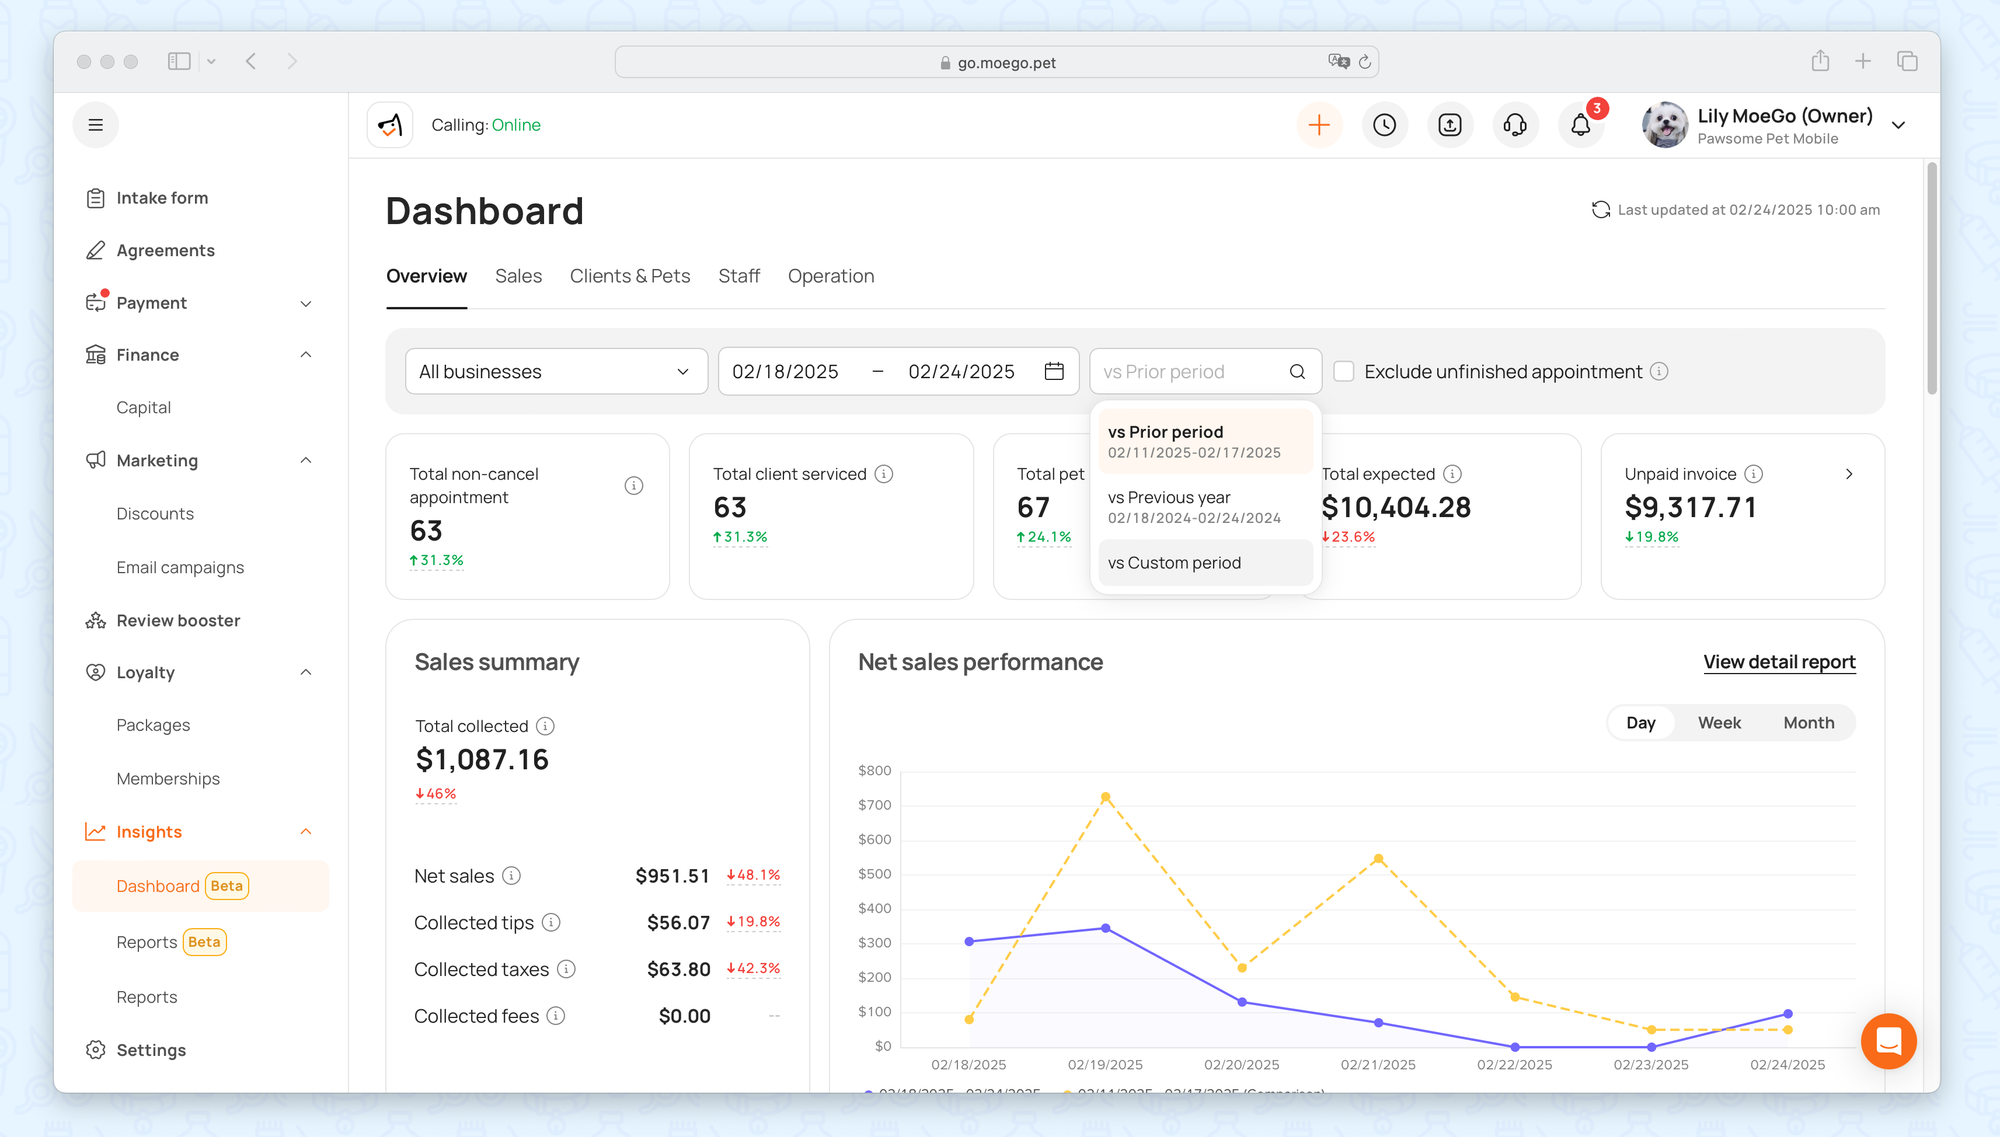
- Compared method:
- Compare with the prior period: (e.g., 12/01/2024 - 12/10/2024)
- Compare with the previous year: (e.g., 12/11/2023 - 12/20/2023)
- Custom period
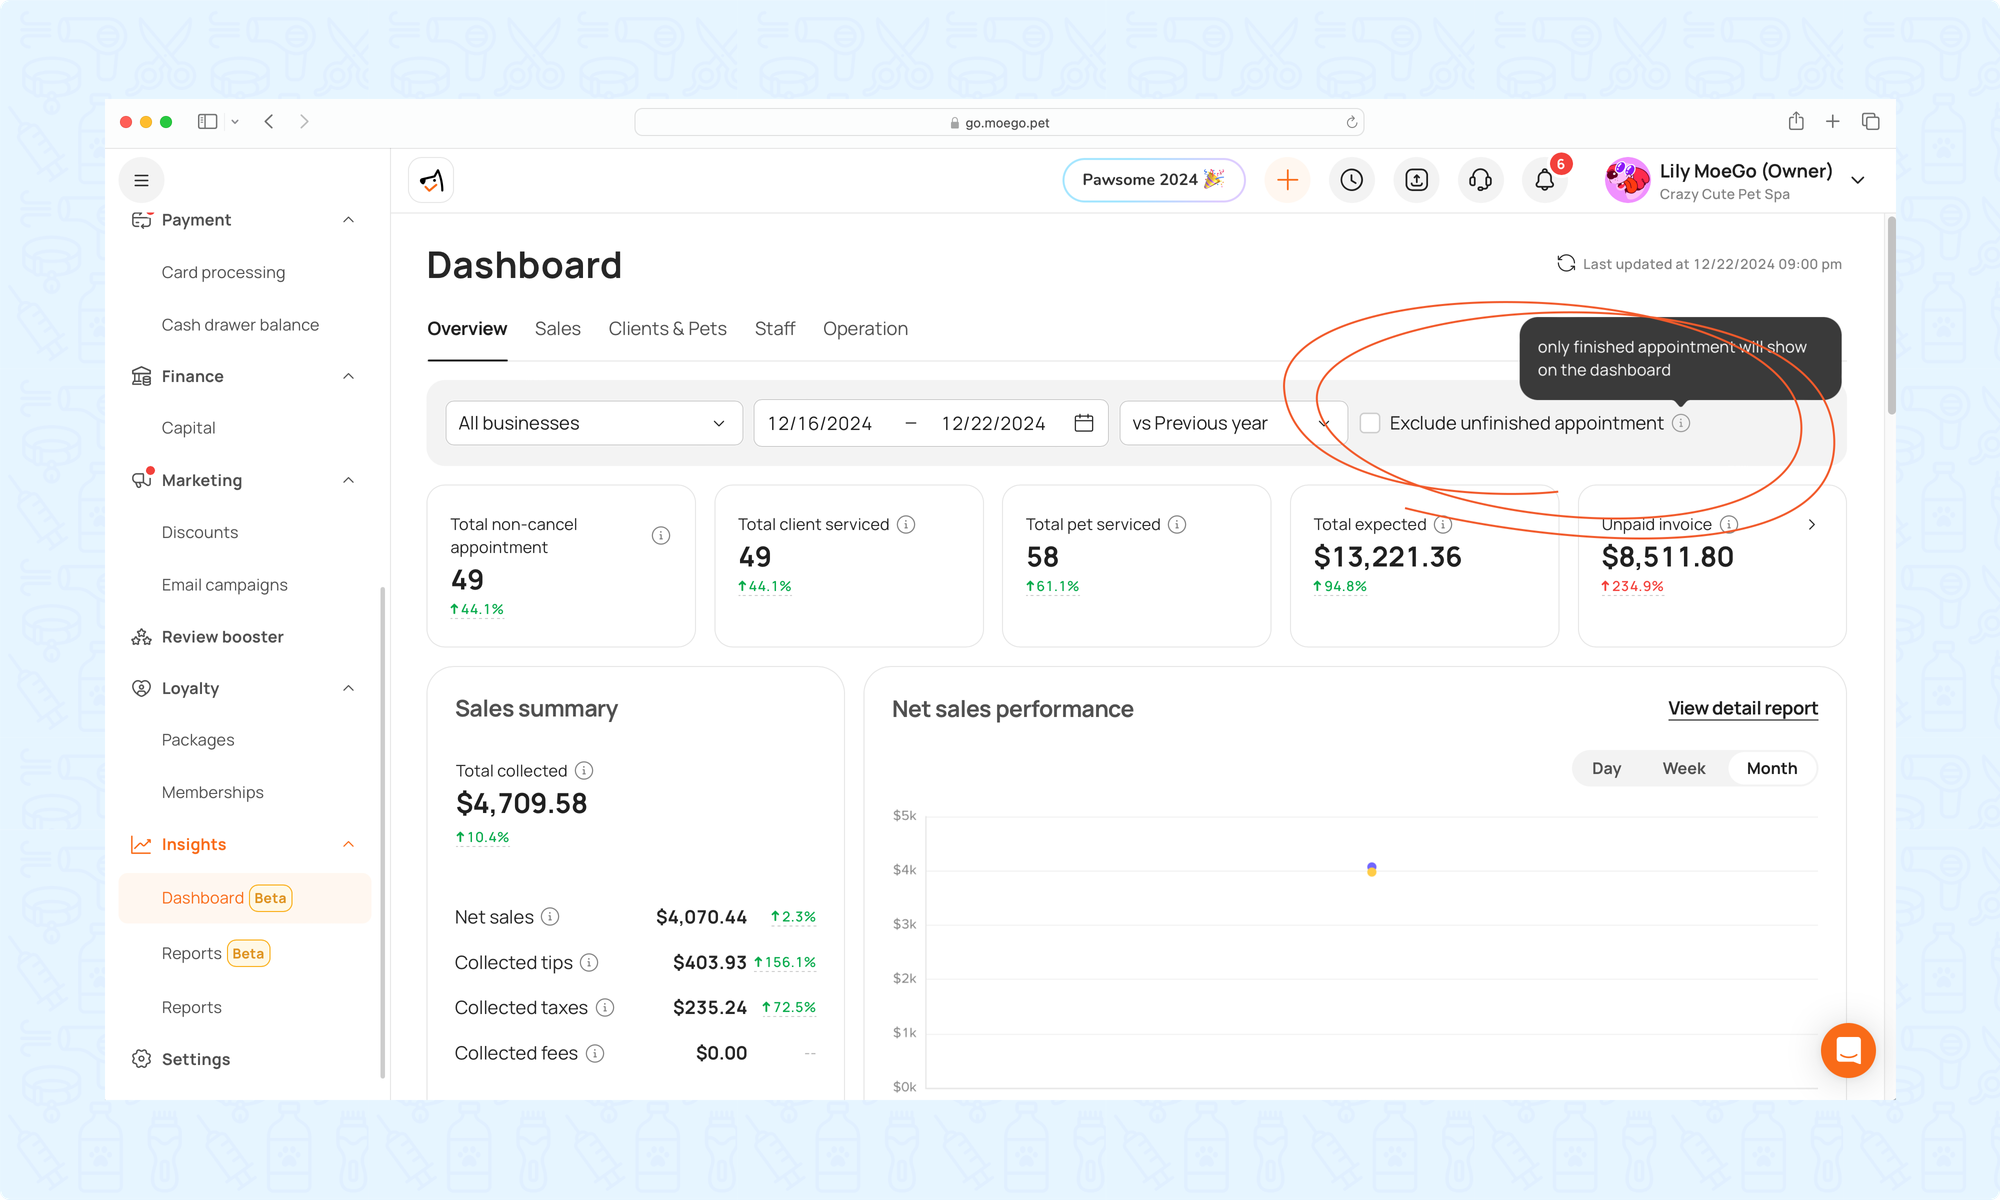
- Exclude unfinished appointments: When enabled, only finished appointments will appear on the dashboard.
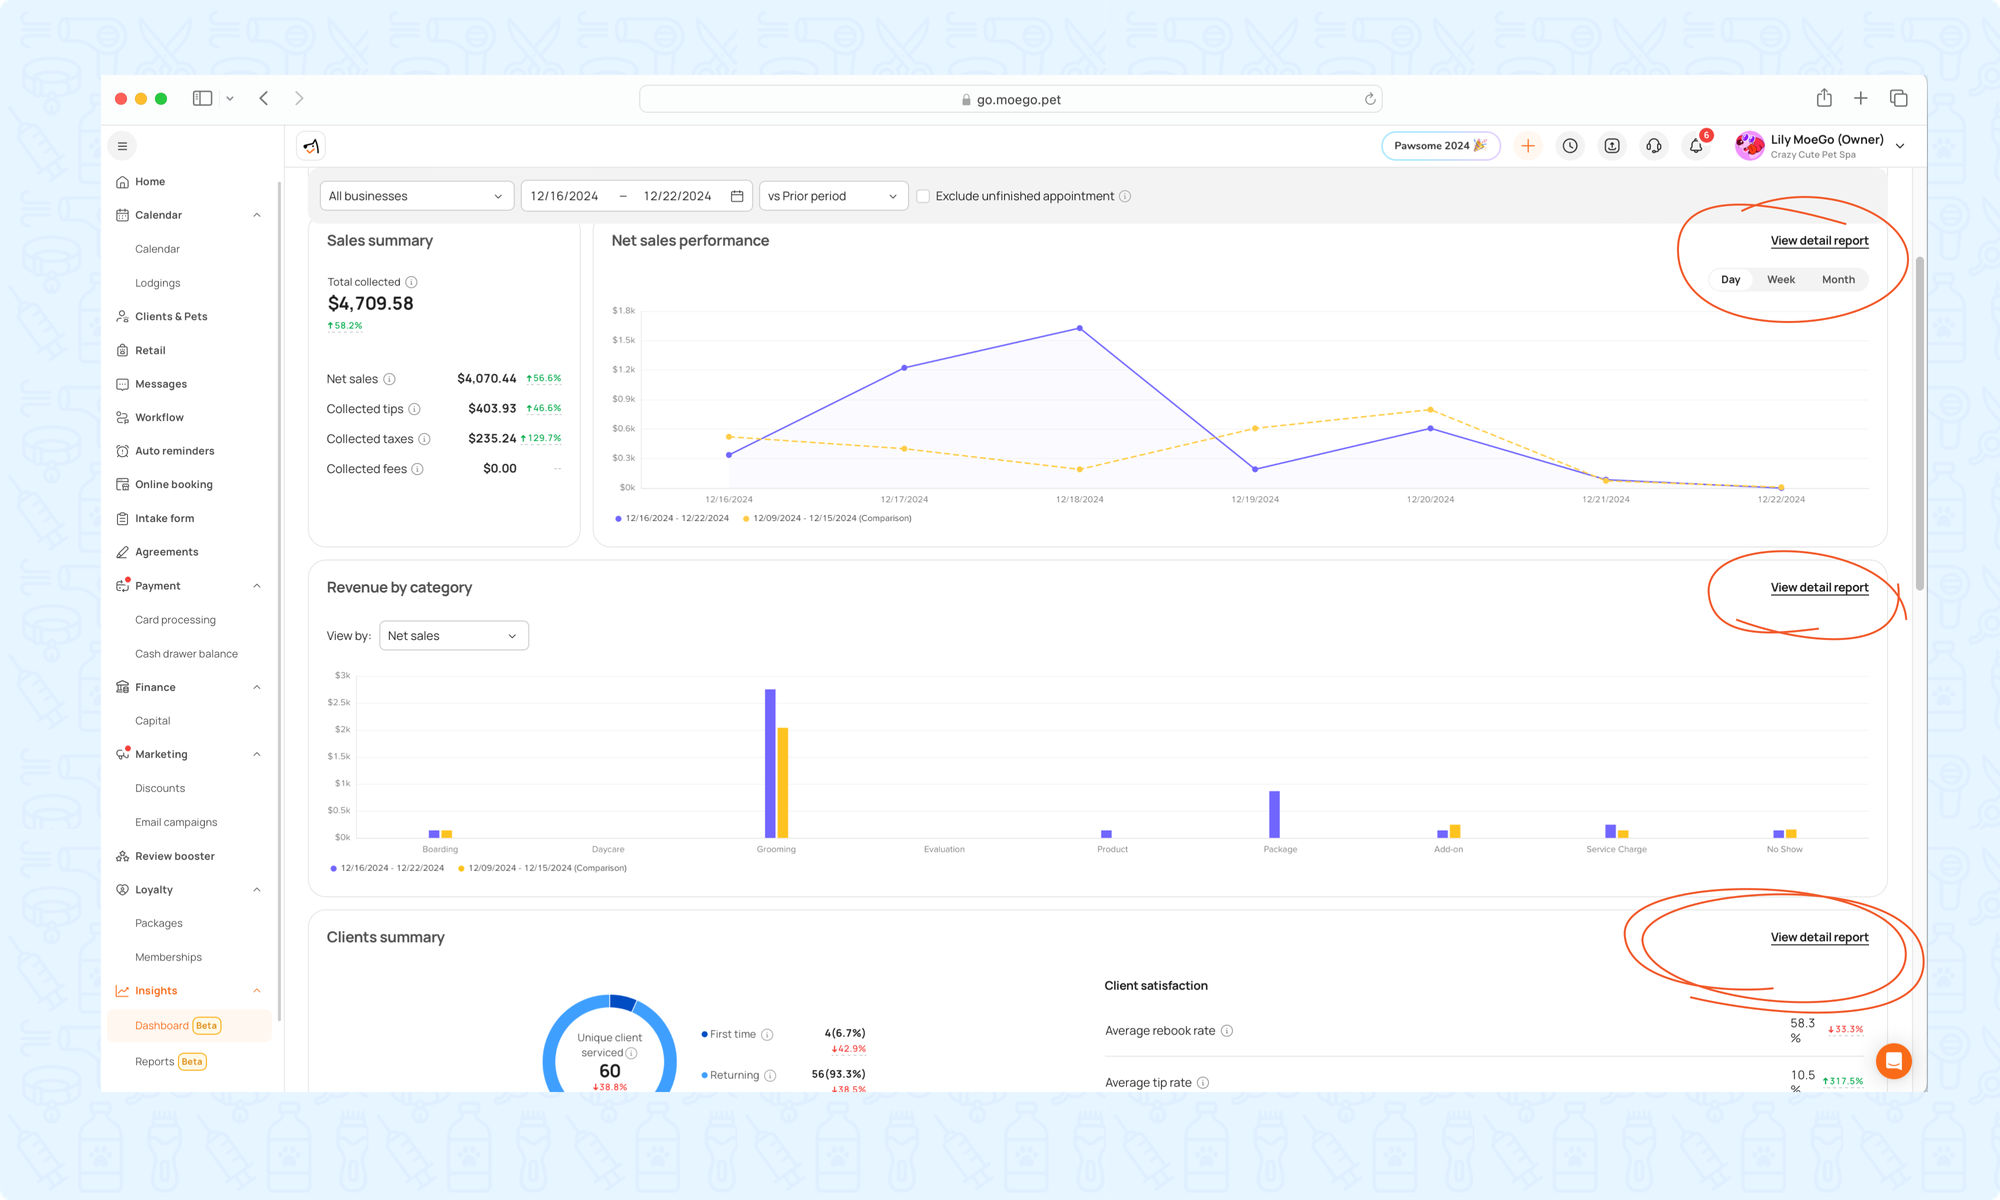
3.View Detail Report
Clicking “View Detail Report” on a widget takes you to the corresponding report in the Reports section, with filters automatically set based on your dashboard settings. This allows you to explore the underlying data behind your metrics for deeper analysis.
*This option is available for all sections in the overview dashboard.
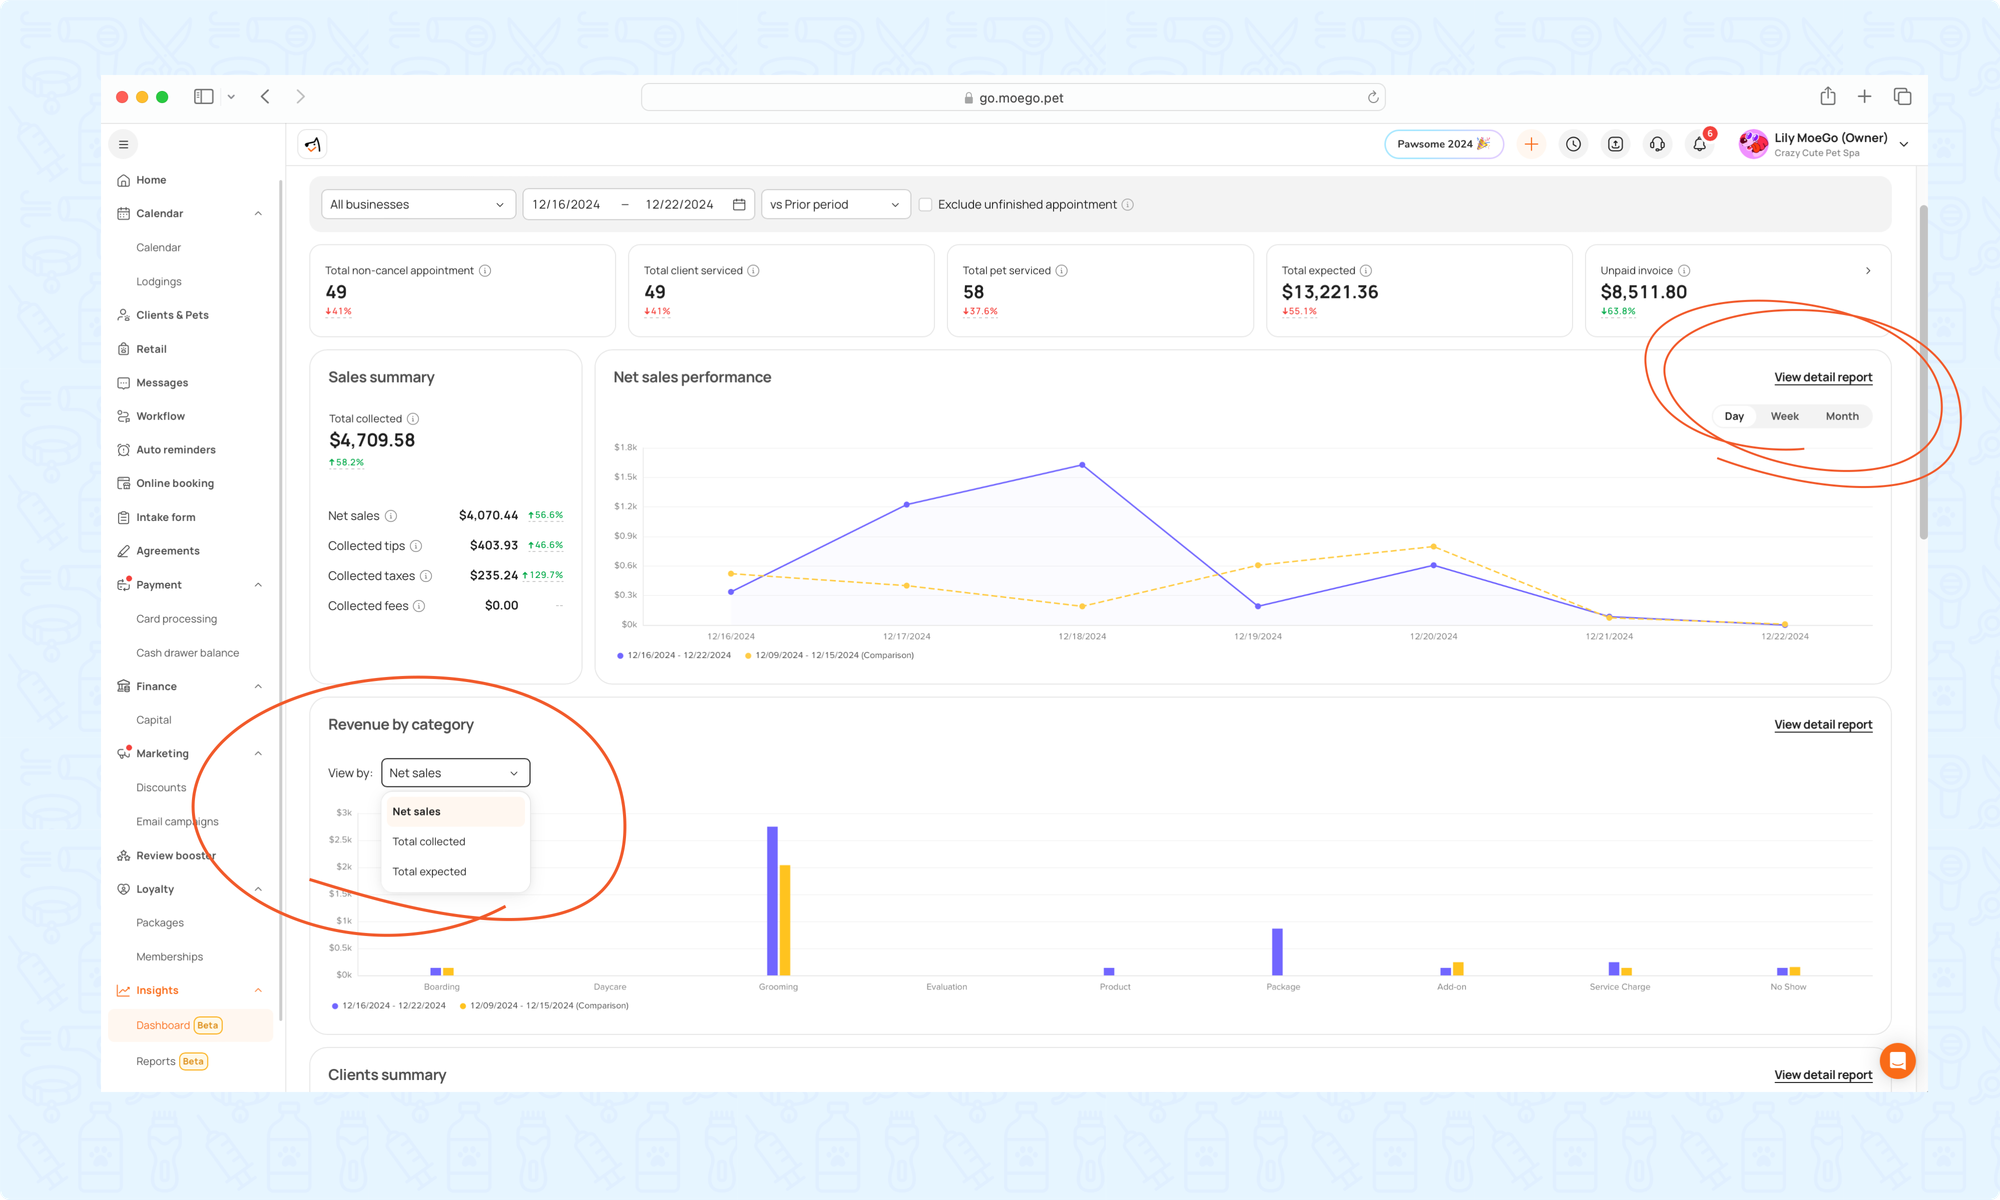
3.View By & Group By
Get better clarity by selecting which metrics to view and how they are segmented
- View By: Choose metrics such as Net Sales, Total Collected, or Total Expected to focus on what matters most.
- Group By: Segment data by Day, Week, or Month for time-based insights.
Dashboard Widgets
Overview
The Overview Dashboard offers a clear, visual summary of your business activity, helping you quickly understand performance at a glance. Definitions of the metrics available in each widget are listed below
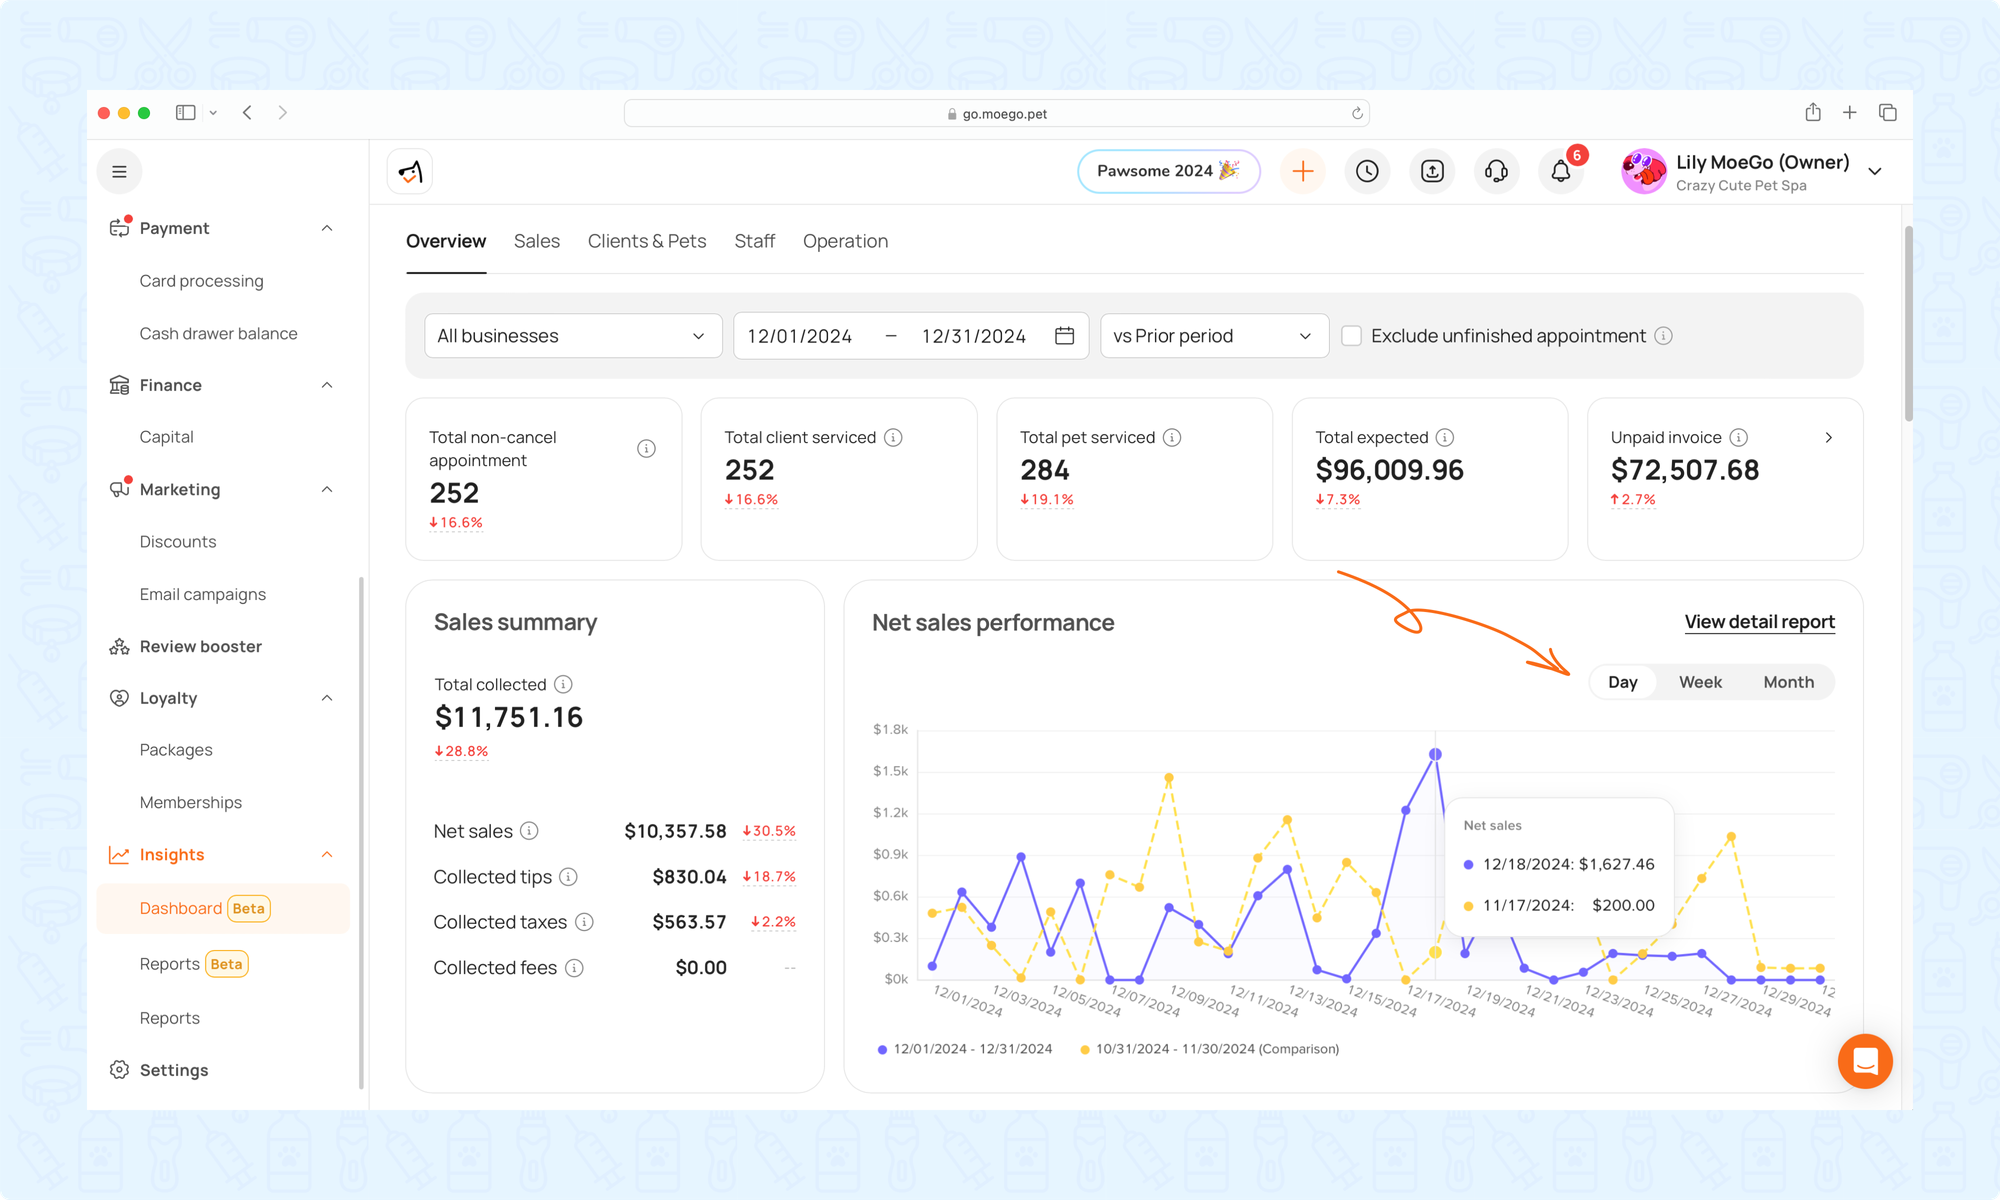
Key performance metrics summary
At-a-glance summary of key business performance metrics.
| Metric | Definition |
| Total Non-Canceled Appointments | The total number of appointments within the selected date range, excluding any that were canceled or marked as no-show. |
| Total Clients Serviced | The number of client visits within the selected date range. If the same client booked multiple appointments, each appointment is counted. |
| Total Pets Serviced | The number of pet visits within the selected date range. If the same pet was booked for multiple appointments, each appointment is counted. |
| Total Expected | The total revenue expected from all invoices, including service charges, tips, and taxes, after applying any discounts and deductions.Total Expected = Service Price + Tax + Tip – Discount – Fee (e.g., client-paid processing fee, if applicable) |
| Total Unpaid | The unpaid balance from all partially paid or unpaid invoices where the outstanding amount is greater than zero.Total Unpaid = Invoice Total – Payments Received |
Sales Summary
This widget shows how each revenue category contributes to your overall revenue
| Metric | Definition |
| Total Collected | The total amount received from all invoices (fully or partially paid), accounting for any refunds.Total Collected = Net Sales + Collected Tips + Collected Taxes + Collected FeesNote: On the Overview Dashboard, this figure includes revenue from packages, retail items, and memberships sold within the selected date range. |
| Net Sales | Revenue earned after discounts and refunds, excluding tips, taxes, and client-paid processing fees.Net Sales = Total Collected – Tips – Taxes – Fees |
| Collected Tips | The total amount of tips collected from all paid invoices (whether partially or fully paid). |
| Collected Taxes | The total amount of taxes collected from all paid invoices (whether partially or fully paid). |
| Collected Fees | The total client-paid processing fees collected from all paid invoices (whether partially or fully paid). |
Revenue By Category
See which parts of your business are bringing in the most revenue, to show where you should allocate your resources to maximize profitability.

Category Breakdown
Displays revenues for various categories like Boarding, Daycare, Grooming, Evaluation, Products, Packages, Membership, Add-ons, Service Charges, No-shows and others.
Customizable Metrics
Toggle between metrics such as Net Sales, Total Collected, and Total Expected, giving you flexibility in analyzing your data based on your business needs.
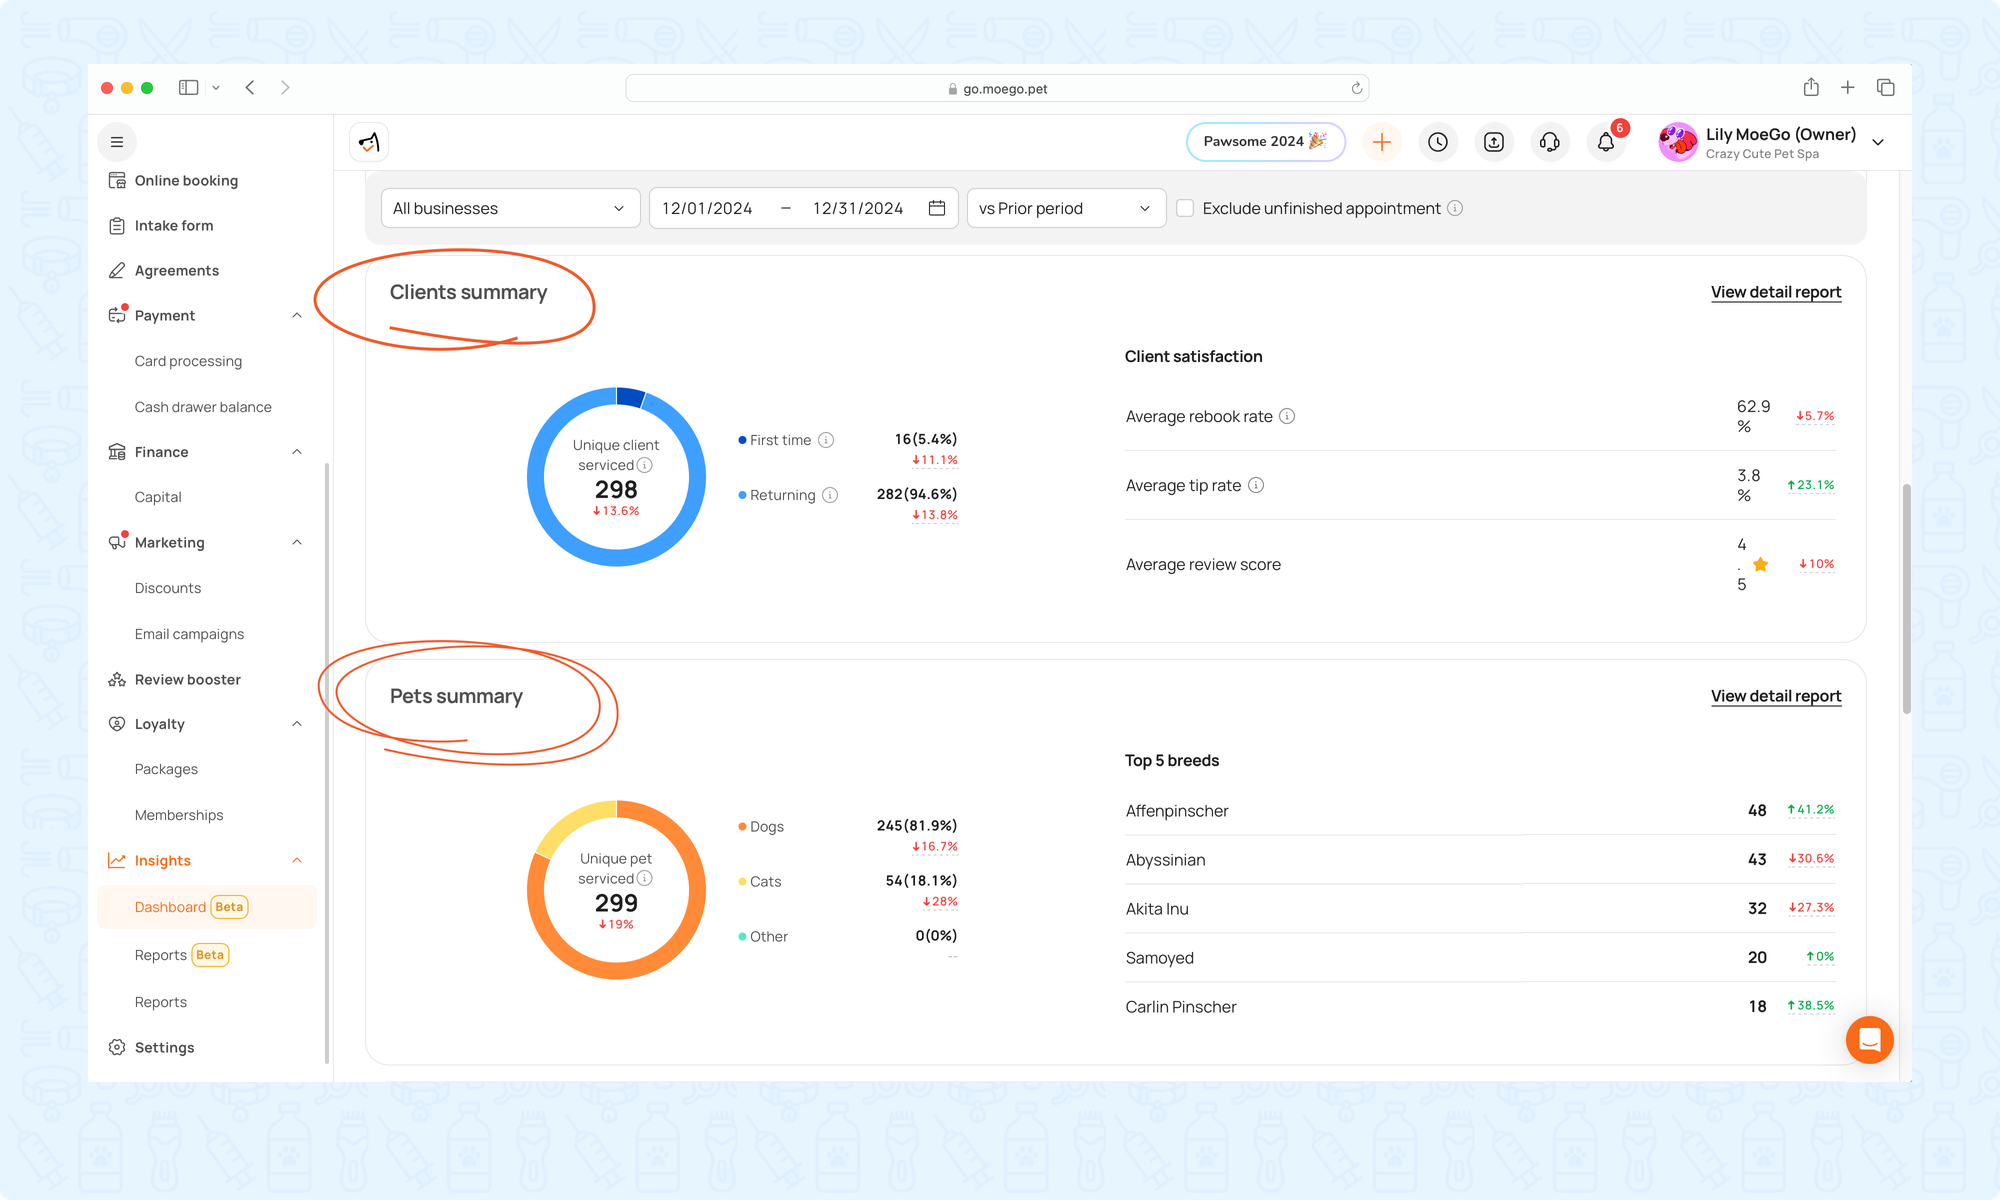
Clients & Pets Summary
Provides an overview of all your clients and their pets. These widgets help you maintain accurate records, monitor visit frequency, and better understand your customer base.
| Metric | Definition |
| Unique Clients Serviced | The number of distinct clients serviced during the selected time period. Repeat visits by the same client are only counted once. |
| Average Rebook Rate | The percentage of clients serviced in the selected date range who also have future appointments booked. |
| Average Tip Rate | The average tip amount collected across all staff members from paid appointments within the selected period. |
| Average Review Score | The average rating received by all staff members from Review Booster submissions and Grooming Report reviews.(Sum of Review Scores / Number of Reviews) × 5 |
| Unique pet serviced | The number of distinct pets serviced during the selected time period. Repeat visits by the same pet are only counted once. |
Appointment Summary
Get a clear and concise overview of your appointments by status (e.g., completed, canceled, no-show) and source - scheduled by staff or booked online. This helps you track operational efficiency and booking trends at a glance.
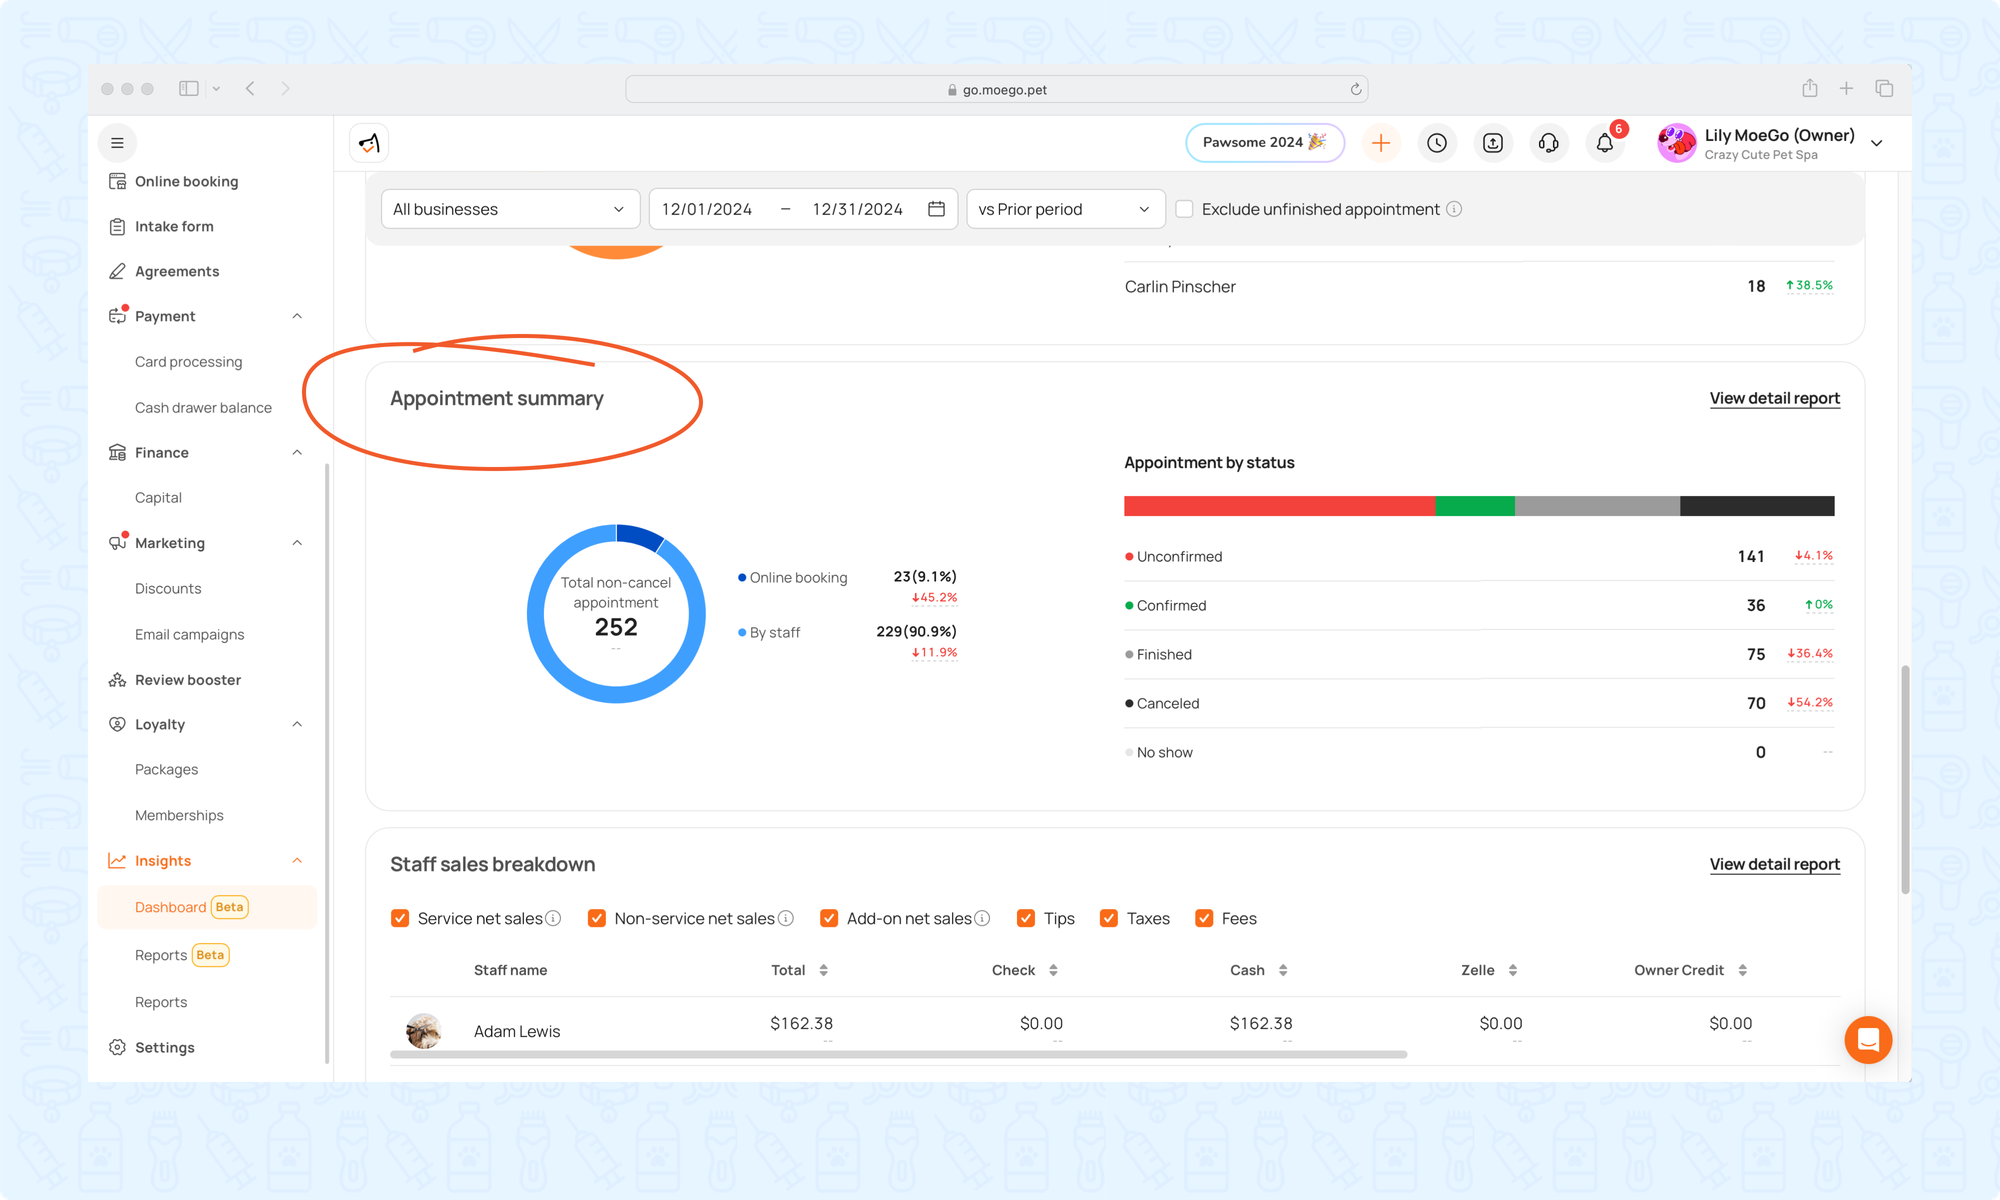
| Metric | Definition |
| Total non-cancel appointment | The total number of appointments within the selected date range, excluding any that were canceled or marked as no-show. |
Staff Sales Breakdown
Gain a comprehensive view of each staff member’s contribution to your business revenue, segmented by revenue streams, payment methods, and key performance metrics.
Staff Performance Tracking
Monitor total sales generated by each team member and track their performance over time, including percentage growth or decline.
*Unassigned staff: Revenue not attributed to a specific team member will appear under this category.
Payment Method Division
View revenue categorized by payment method (e.g. card, cash, or 3rd party payment methods)
Customizable Revenue Streams
Easily toggle between different revenue categories to focus on the segments most relevant to you:
- Service net sales: Revenue from core services such as Grooming, Boarding, and Daycare.
- Non-service net sales: Revenue from Products, Memberships, Packages, Evaluations, No-Show Fees, and Service Charges.
- Add-on net sales: Revenue generated from optional add-on services added to appointments

Frequently Asked Questions
Q: Why didn't I see this section in my report section?
A: This section is currently available by request as our reporting team continues to enhance the overall reporting experience. If you’d like to have it enabled, please reach out to us via Support Chat.
Feel free to contact MoeGo Support if you have any further questions!